Bring sustainability data to life
Visualize and analyze complex sustainability data for an accelerated energy transition. Involve stakeholders in climate adaptation and green plans. Discover TouchTable as the ultimate maptable for sustainability projects.
Gebruikt door o.a.
What is the Sustainability Table?
The Sustainability Table combines a large multi-touch screen with powerful sustainability software. With this, you transform every discussion about climate adaptation, energy transition or sustainability goals into a visual and interactive conversation where everyone can participate.
Why the Sustainability Table?
Municipalities & provinces
for climate adaptation and sustainability policy.
Consultancy firms & engineers
for sustainability analyses and project presentations.
Companies & organizations
to visualize and discuss sustainability goals.

Powerful Software Integration
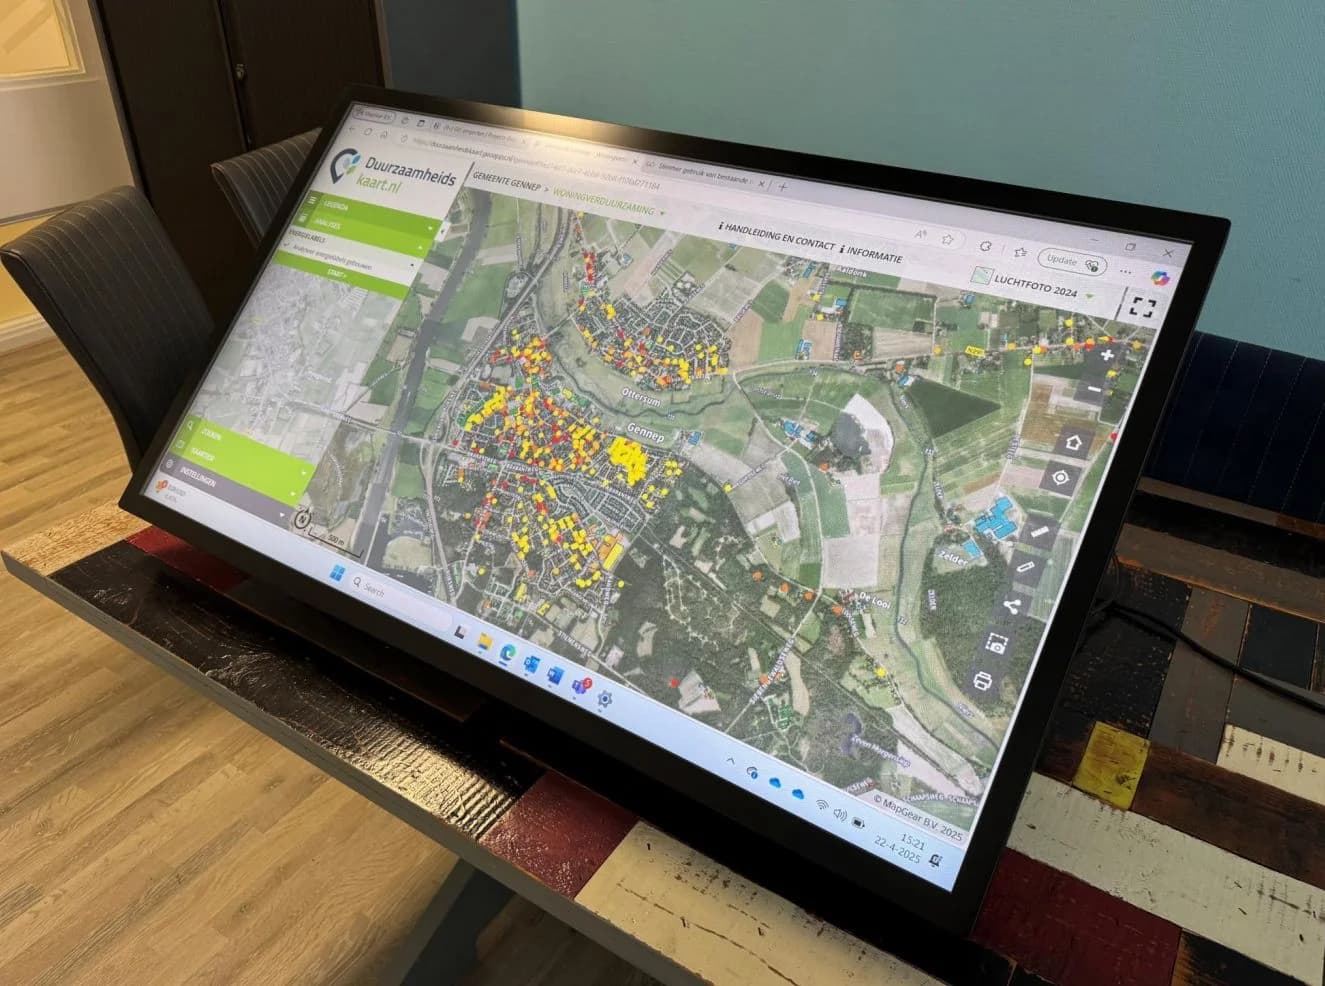
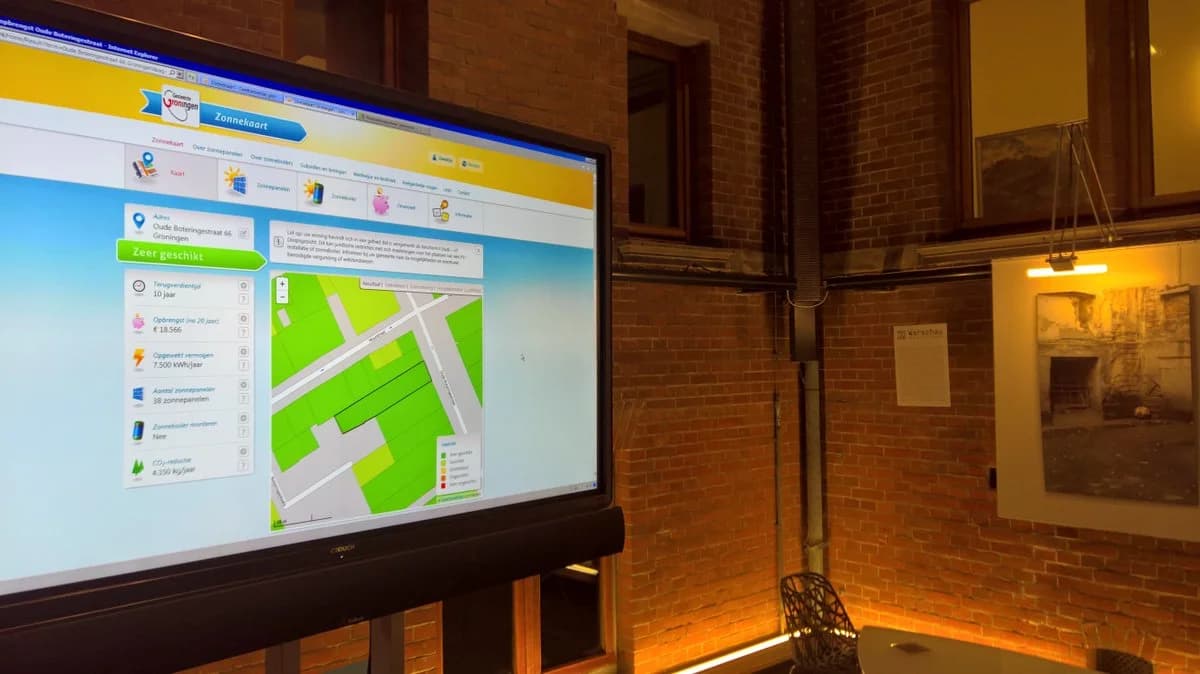
The Sustainability Table works seamlessly with the Sustainability Map software. This platform offers extensive capabilities for visualizing and analyzing sustainability data, climate adaptation and energy transition.
Available features:
- Interactive theme maps and dashboards
- Advanced data analysis tools
- 3D visualizations and scenarios
- Collaboration tools for teams
- Extensive import/export capabilities
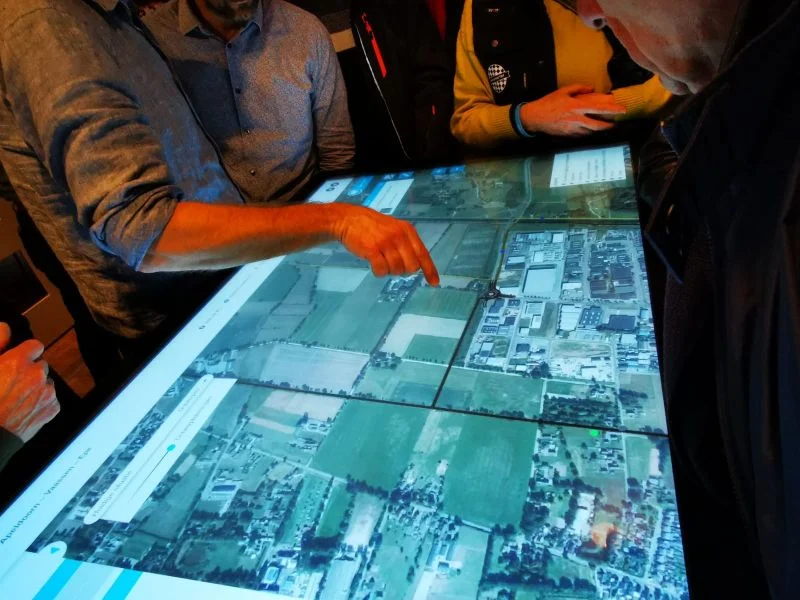
Direct interaction at the table
Analyze and discuss complex sustainability data in teams.
Visual & intuitive
Make data understandable with interactive maps and dashboards.
Data-driven dialogue
Combine data and local knowledge for supported decisions.
Better understanding
Complex data becomes visual and understandable for everyone.
More effective collaboration
Work simultaneously on the same data for faster results.
Supported decision-making
Involve all stakeholders for plans with more support.
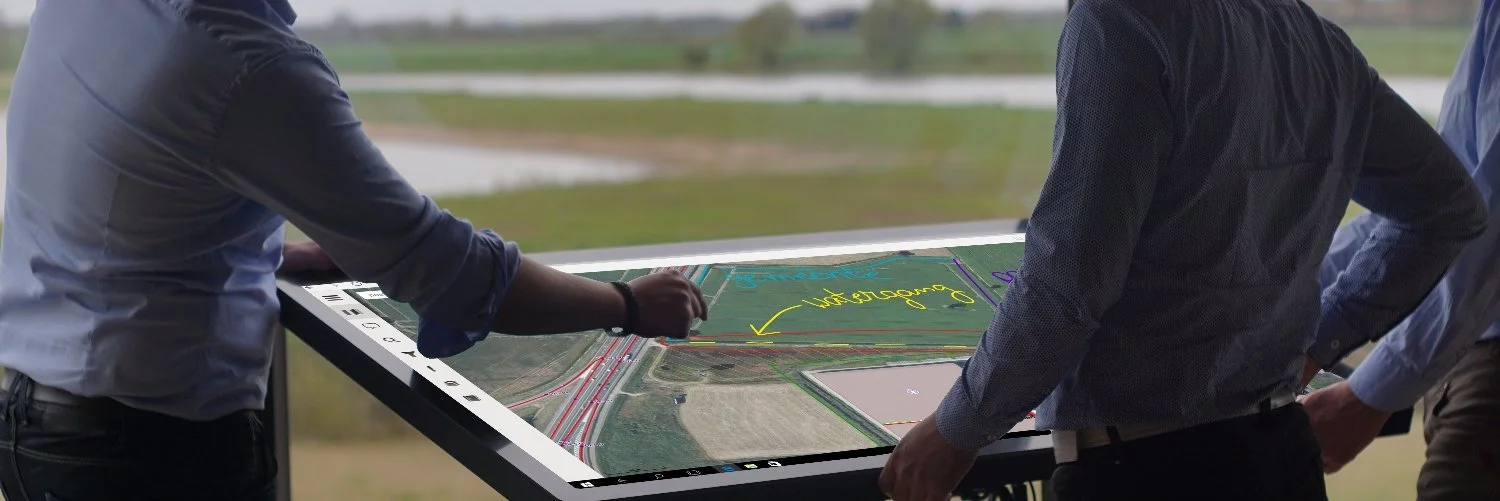
Sustainability Table in Practice
See how the Sustainability Table is used for various sustainability projects and climate adaptation
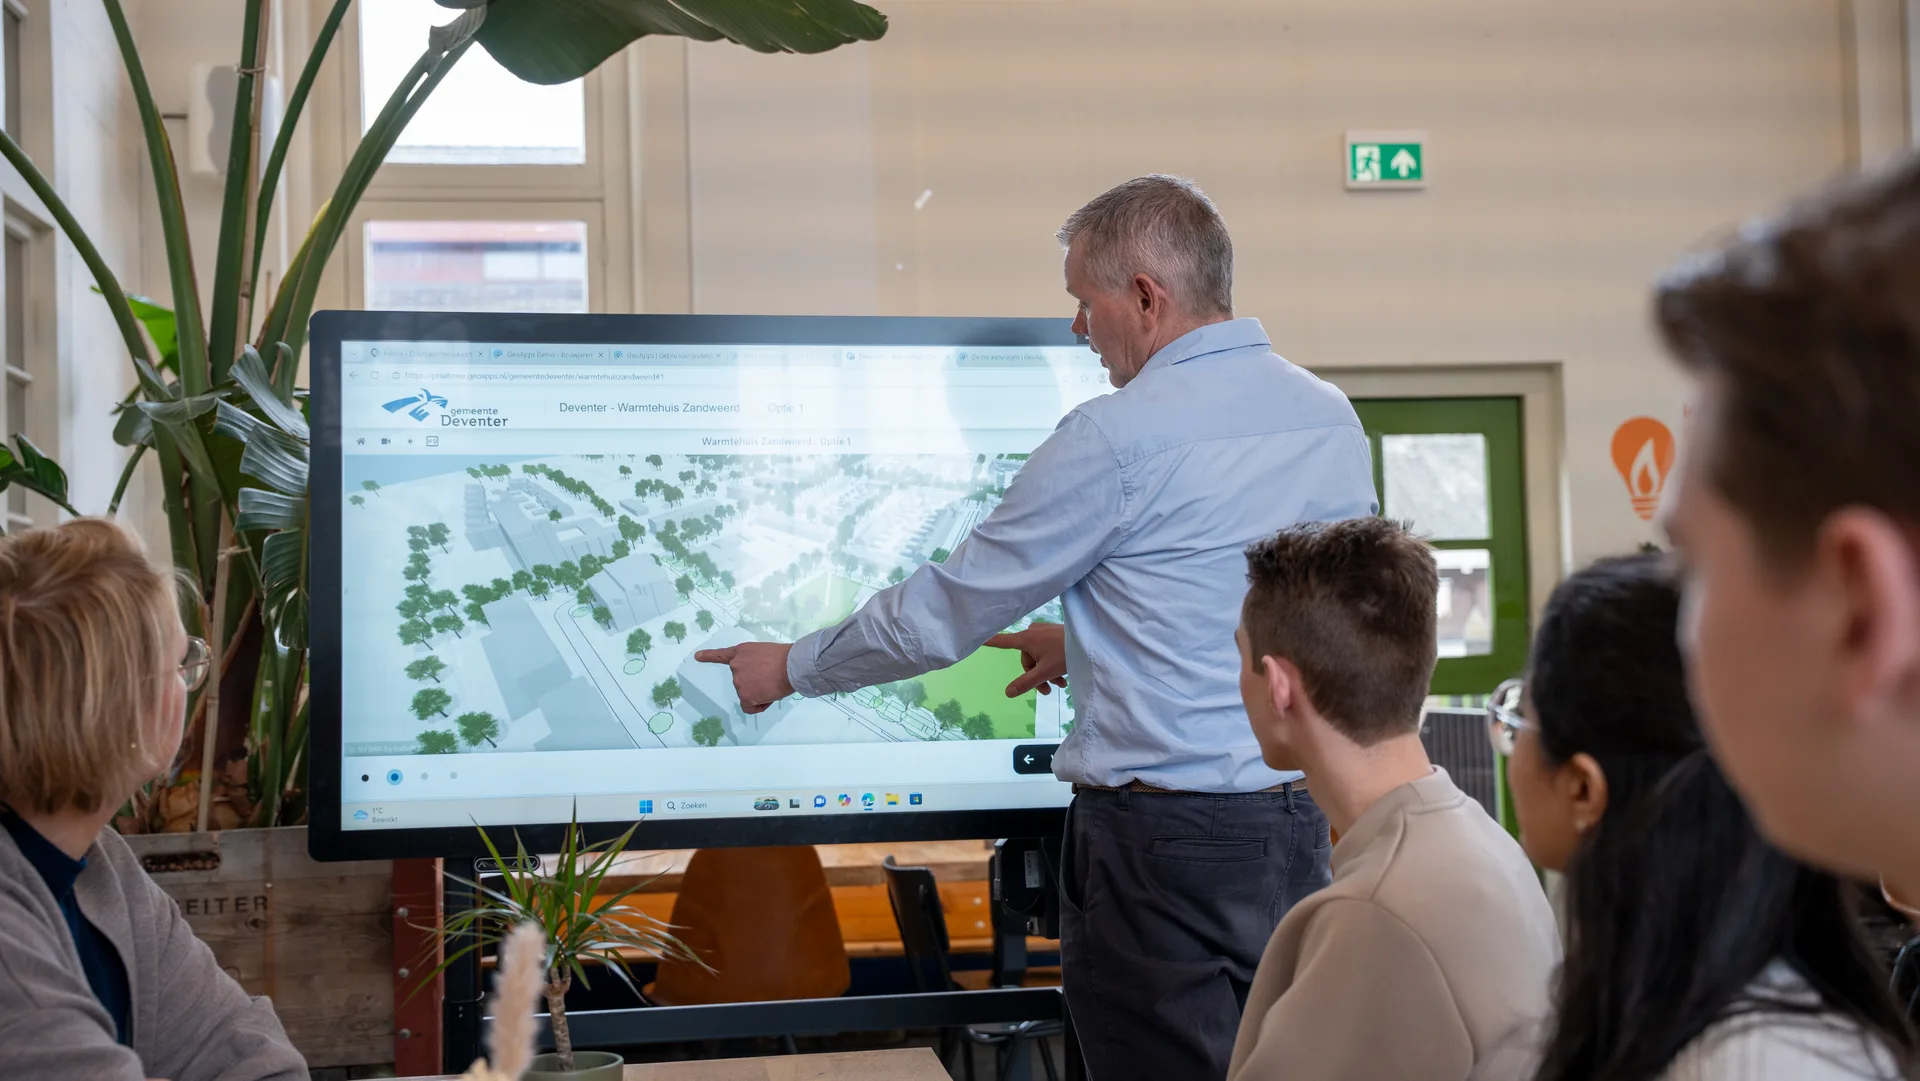
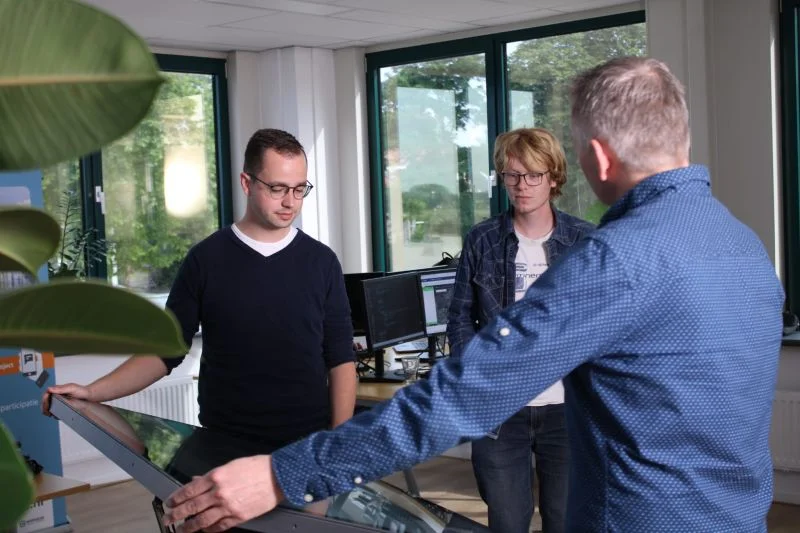
Interactive sustainability session with the Sustainability Table
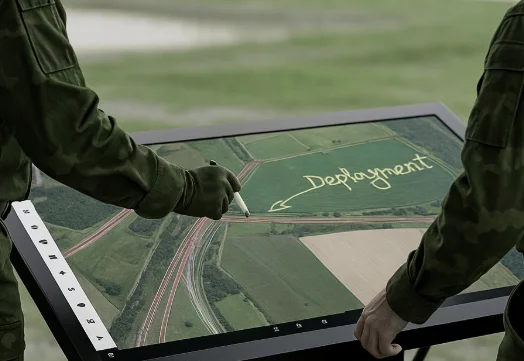
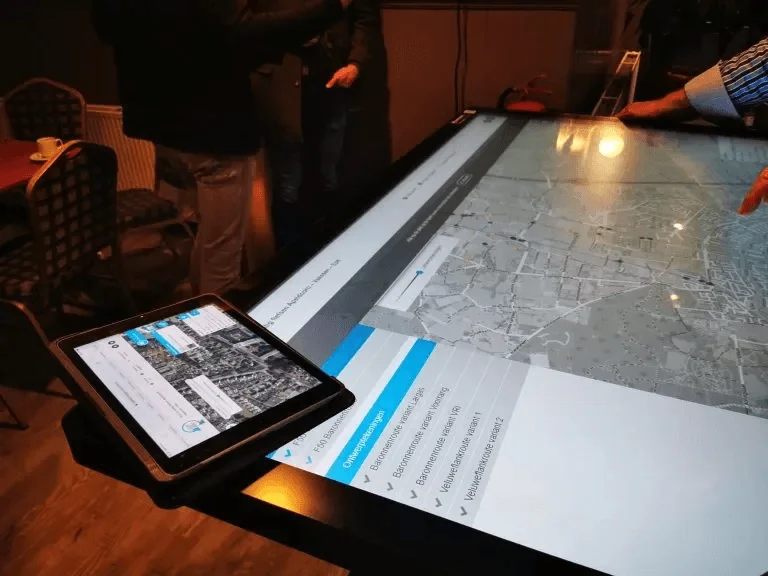
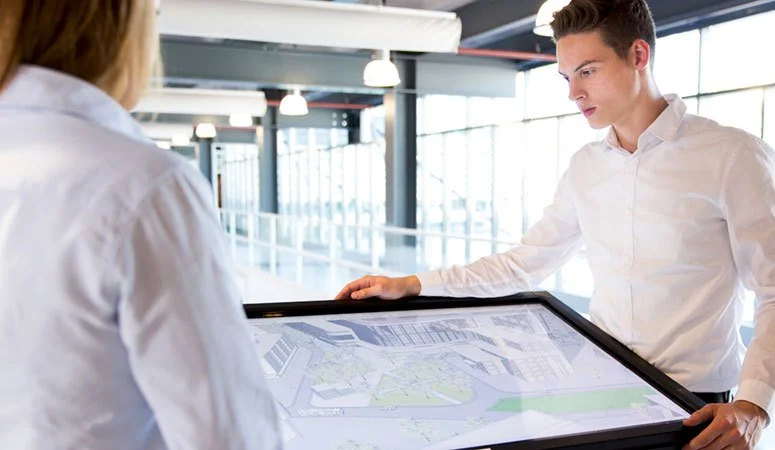
TouchTable Go and Standard for sustainability projects
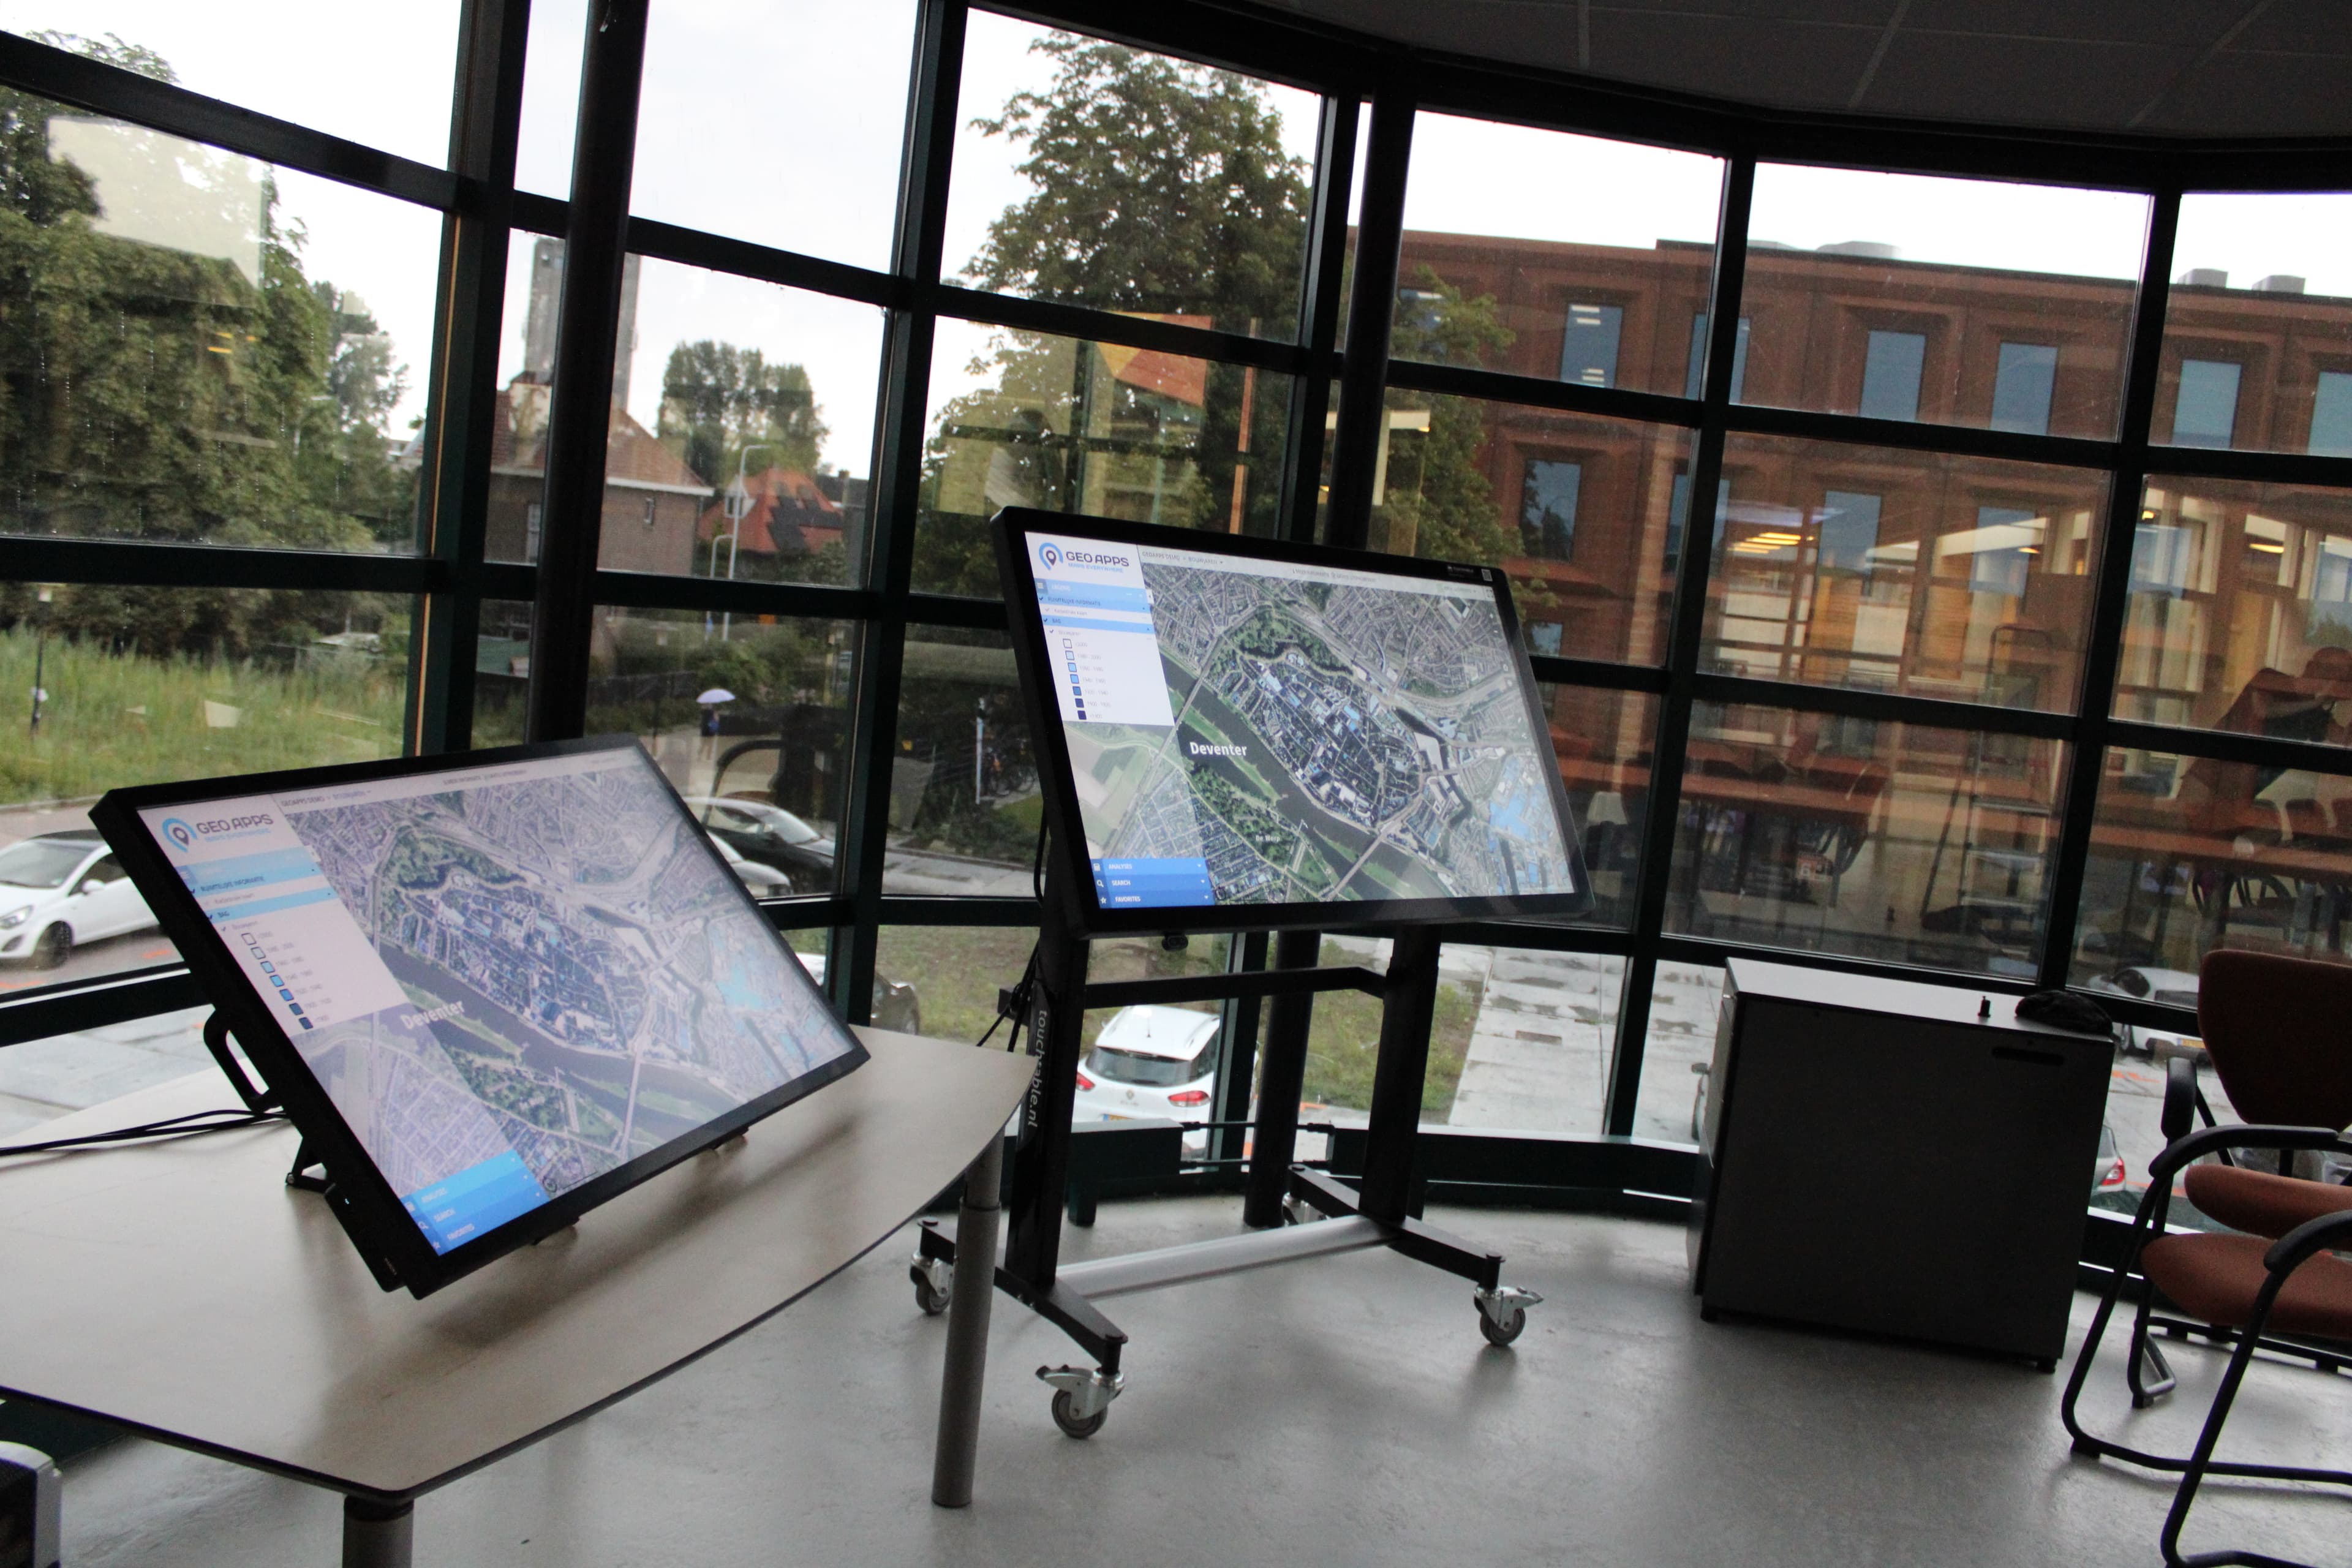
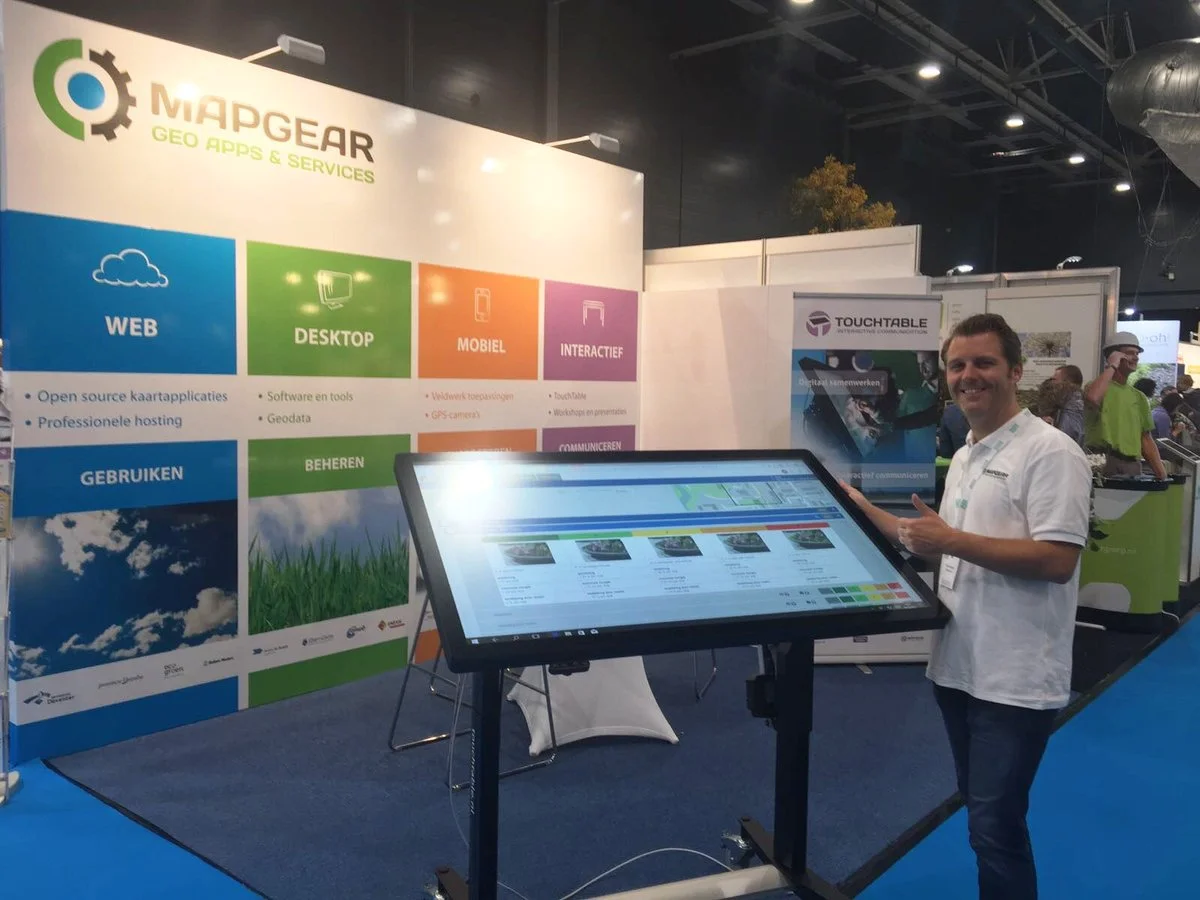
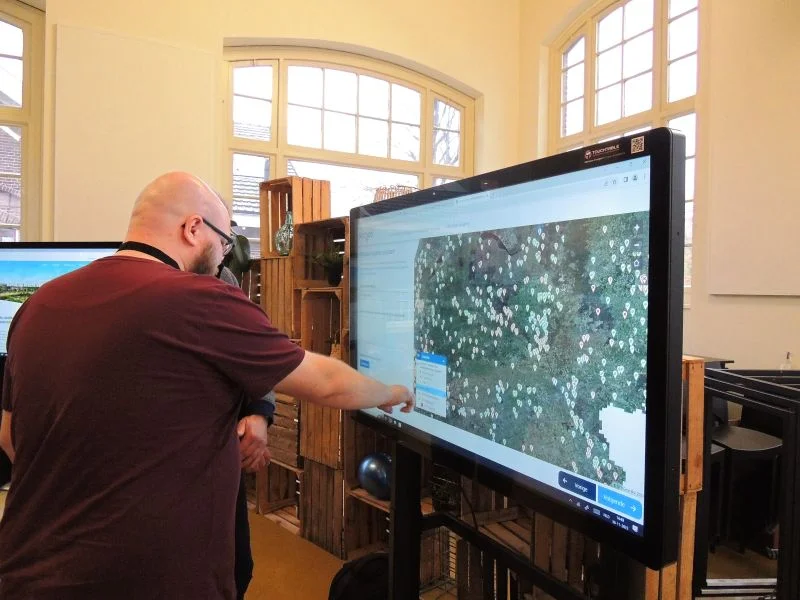
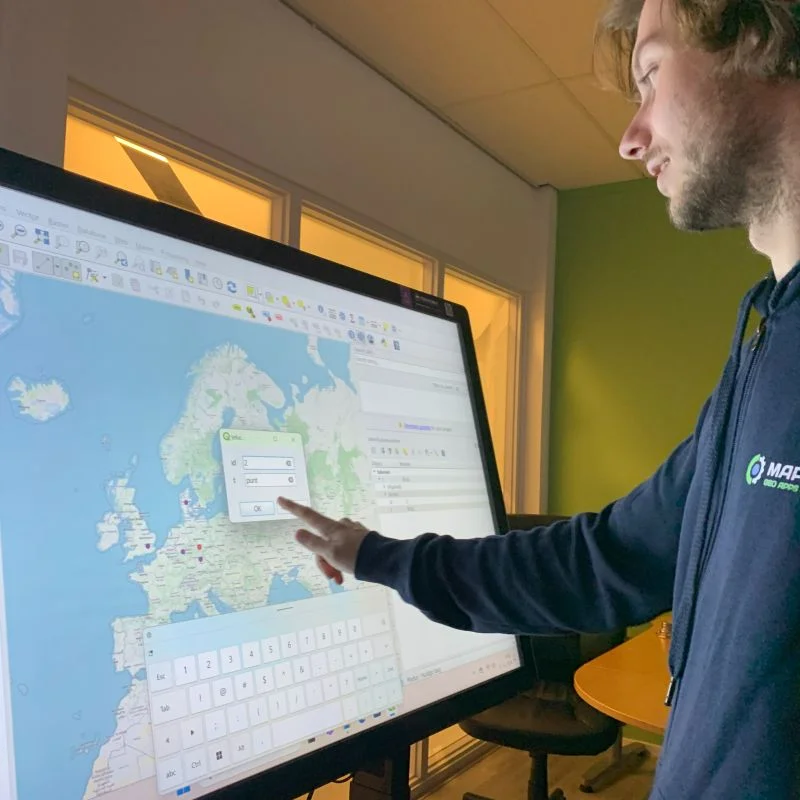
Digital Map Table for GIS and sustainability analysis
What's included?
Applications
- Climate adaptation planning and scenario analysis
- Energy transition workshop with stakeholders
- Knowledge sessions on solar-on-roof potential
- Stakeholder dialogues on sustainability goals
- Exploratory studies on biodiversity and green management
Features
- Interactive theme maps (energy, water, green etc.)
- Dashboarding with live data connections
- Scenario analysis and comparison tools
- Full integration with the Sustainability Map software
Need more information?
Download our specsheet and brochure for all technical details and specifications.
Want to know more?
Do you have questions about our products? Would you like to request a demo or quote, or are you interested in Try & Buy or rental? Fill out the form and we will contact you.

Direct contact
Support & Service
We help you make optimal use of your TouchTable.
Try & Buy Program
Demo at office or online
Schedule a no-obligation demonstration at our office or online via video call.
Rent before you buy
Test the TouchTable extensively by renting first. When purchasing within a week after rental, the rental price (of 1 day) is deducted from the purchase amount.
Personal advice
Contact us for questions and custom advice about the best TouchTable for your situation.
TouchTable in action
From trade shows to education, from crisis management to participation - discover how TouchTable is deployed.
Crisis Management
Education
Trade Shows

Sustainability
Office Environment
Map Visualization
Participation
Events
Spatial Planning
Presentations
Digital Maps
Collaboration
Ready to discover TouchTable?
Transform your presentations, meetings and collaboration with the power of interactive technology. Request a quote today or schedule a demonstration.
Request quote